

Last week GS1 US published their “2019 Update: Barcode Readability for DSCSA 2023 Interoperability” in conjunction with the Big 3 wholesale distributors, AmerisourceBergen, McKesson and Cardinal Health. You’ve probably already seen it, but probably not like this. Keep reading.
This year there was a significant jump in the percentage of drug products containing the 2D barcode mandated by the Drug Supply Chain Security Act (DSCSA). The problem is, for the last three years they have published their data four to five months after they collected the data (see also “Wholesalers Find Troubling Results In DSCSA Barcode Assessment“). What everyone really wants to know is, what percentage of drugs would have been marked with the 2D barcode in November of 2018 and today, not back in June of those years. And with three years’ worth of data, you can make a reasonable extrapolation of the data for the November dates, if you just apply a little spreadsheet and graphics skills. Let’s try it.
The first thing we do is enter the actual read points in a spreadsheet. To extrapolate what the data would be on dates between those actual read points, we need to add extra “read points”. According to GS1 US, AmerisourceBergen and McKesson performed their assessments between May and July each year. I narrowed that to “June” each year and added three extra, evenly spaced, extrapolated “measurements” per year, “March”, “September” and “December”. I then set the data for each of the extrapolated months to values that resulted in a smooth plot on a line graph. This is an iterative process. Make a guess at the extrapolated data, look at the resulting graph, update the guesses until the graph looks smooth. The results are shown here:
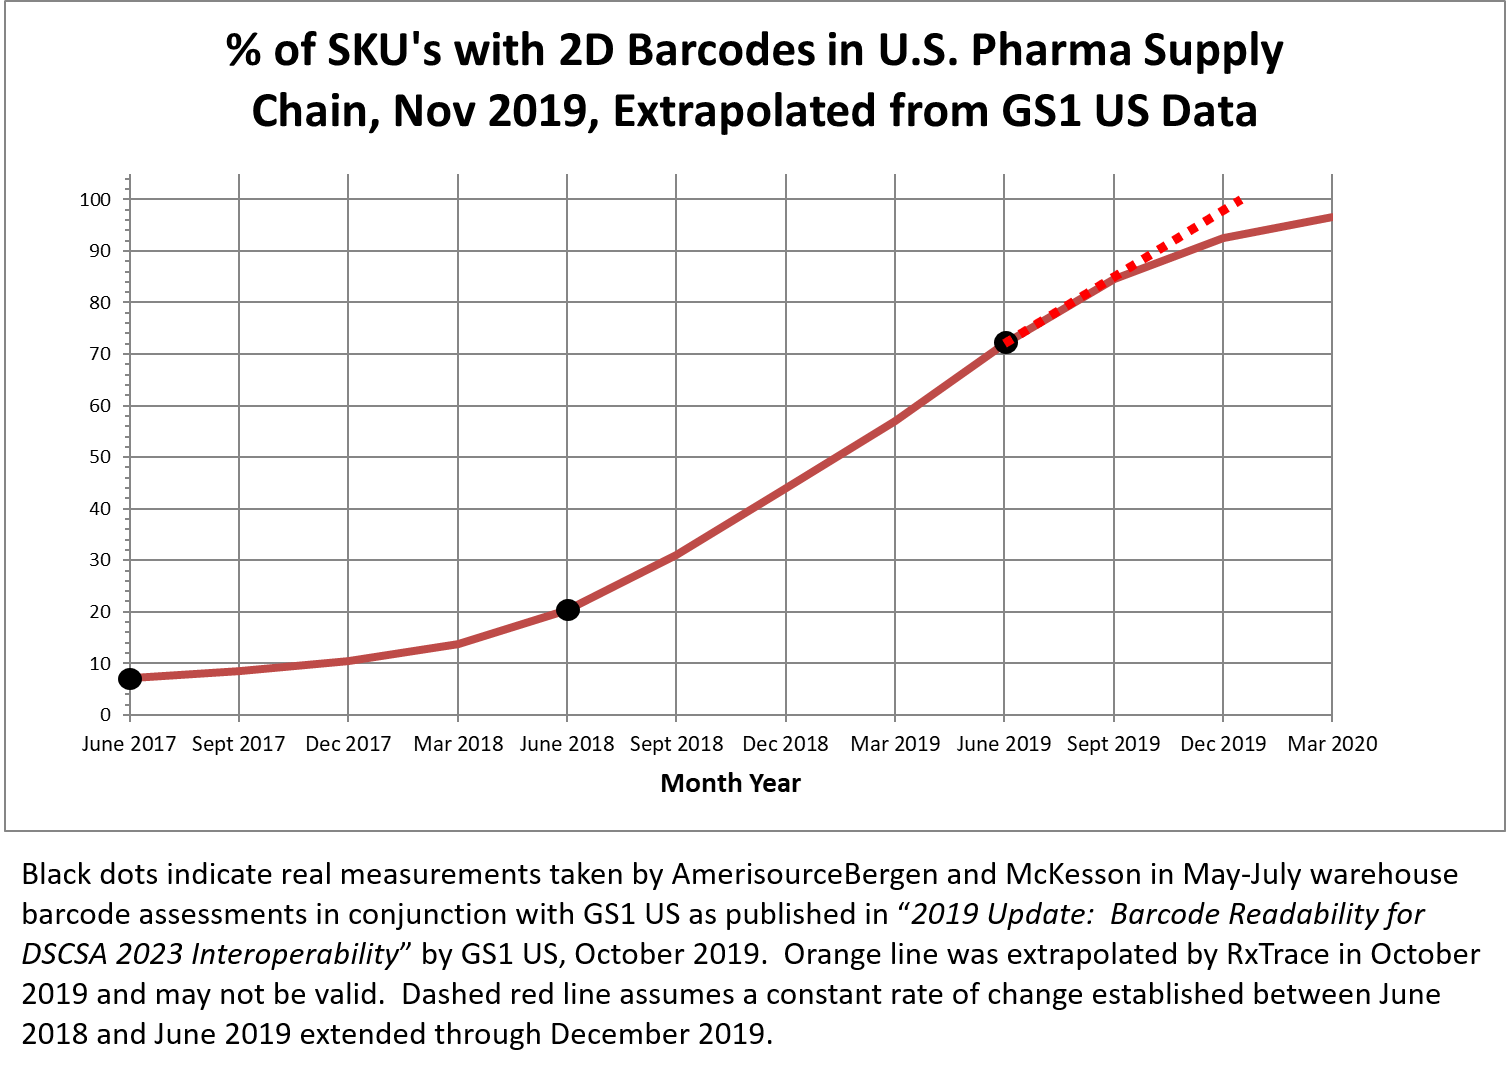
Data extrapolations like this have a fair amount of truth to them, but if it were possible to see a plot of the actual data, it would probably jump around a lot more than the smooth line shown on this graph. But that jumpy line would still approximate the line I have constructed, at least between the first and the third actual measurements (shown as black dots on the graph). That said, this is an extrapolation, which means all of the data points outside of the black dots are made up intentionally to create a smooth line. Just be aware of that as I now attempt to make a few observations from this made-up data.
If the made-up data is close to accurate, we can see that the FDA made the right decision to provide manufacturers with enforcement discretion between November 27, 2017 and November 27, 2018 (see “FDA Delays Enforcement of DSCSA November Deadline: What It Means”). But even so, the percentage of SKUs in the wholesaler’s inventories around December 1, 2018—a few days after enforcement discretion ended—would have been only around 44%. Most of those products without 2D barcodes at that time would have fallen under the FDA grandfathering provisions (see “FDA’s New DSCSA Grandfathering Guidance”), but that’s a lot to sort through to find actual violations. Fortunately, as the graph shows, the percentage was increasing by more than 10% per quarter at that time, ending up at the measured reading of 72% in June of 2019.
But it wouldn’t have stopped there. If you follow my red dashed line, created by simply continuing the linear rate of change between the measurements taken in June of 2018 and 2019, the percentage would, theoretically, hit 100% right around the end of this year. But things never increase at a linear rate right up to 100%. The rate of change—the slope of the plotline—always declines as the value approaches 100%, so my graph shows my guess at that decline, projecting it will reach 100% probably sometime in late 2020.
Still, that’s not bad. Consider, this would mean almost all drugs covered by the DSCSA would be serialized through the inventories of wholesale distributors by the time when dispensers are required to only buy drugs that are serialized (November 27, 2020). This is exactly why these segment-specific deadlines were spread over multiple years. Once serialized products permeate the inventories of the large wholesale distributors they will penetrate the inventories of dispensers quickly. That’s because wholesalers hold a lot more inventory than dispensers do. Once that happens, we might start to see members of the supply chain finally taking advantage of the contents of those 2D barcodes for beneficial applications that go beyond those required by the DSCSA.
Cardinal Health and McKesson both hinted at those applications near the end of the GS1 US paper. Scott Mooney of McKesson mentioned the use of the lot number for automated recall checking and Quentin Dittman of Cardinal Health mentioned expected efficiencies in receiving and other warehouse processes (see “We Should Be Ashamed Of The U.S. Approach To Pharma Recalls” and “The 2 Most Helpful Requirements In The DSCSA”). I like how these guys think. These are the applications I always looked forward to being a part of when I was at Cardinal Health. The timing just didn’t work out for me, but it will work out perfectly for others like me. I would look forward to being proud of them, but odds are, I’ll never see what they’ve done because these will be internal applications that won’t get any external publicity. So I’ll just have to imagine they are being done and imagine the fun of those doing the work.
Now, if we could just get rid of that useless linear barcode…
Dirk.
